Mapping the Distribution of Nitrogen Dioxide in the Mississippi Region
Nitrogen dioxide is the product of numerous combustion processes initiated by humankind. Using satellite techniques, its associated trace gases can be mapped, allowing the sources of their emission—natural and anthropogenic—to be identified, quantified and spatially plotted. This project maps the way pockets of nitrogen dioxide have accumulated in the Mississippi region, comparing this activity with the average distribution found along the Nile and Yangtse.

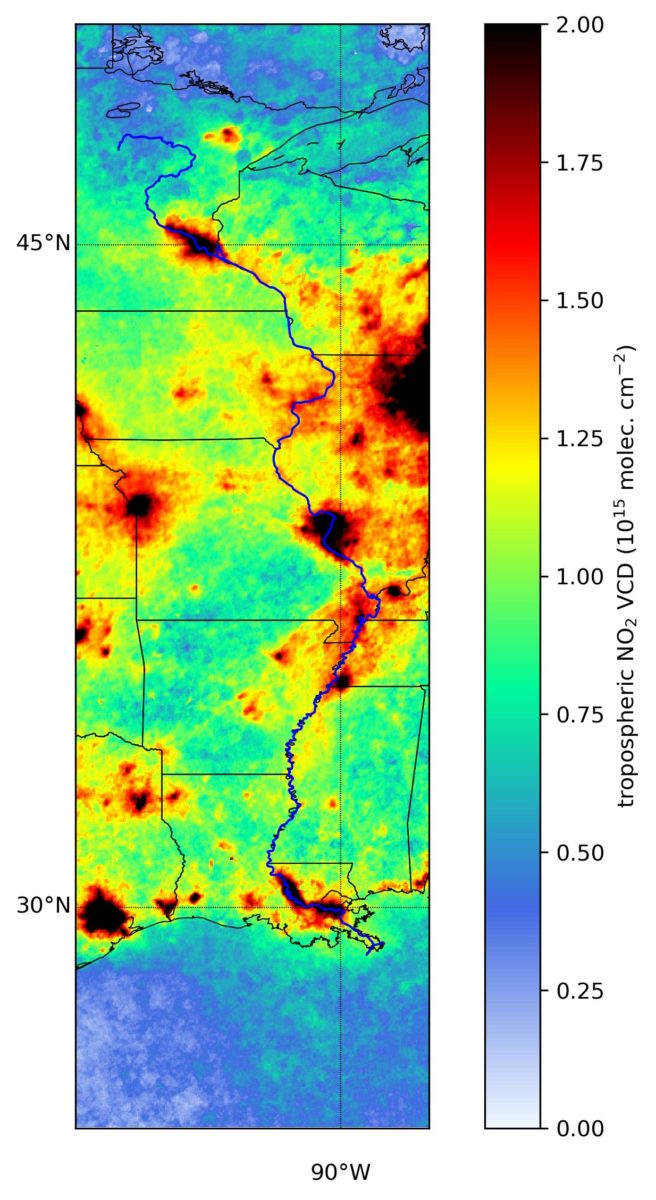
Modern satellite instruments—like S-5P/TROPOMI (ESA), active since October 2017—measure spectra of backscattered solar UV and visible radiation with high spatial resolution (7×3.5 km²). From these spectra, we can derive the atmospheric columns (vertically integrated concentrations) of several trace gases. Here, we show a map of the average tropospheric NO2 column along the Mississippi River, derived from the satellite observations of S-5P/TROPOMI between December 2017 and October 2018 (data-processing and gridding by Christian Borger and Steffen Beirle, Max-Planck-Institute for Chemistry, Mainz, Germany; data source: S-5P/TROPOMI from ESA/Copernicus).
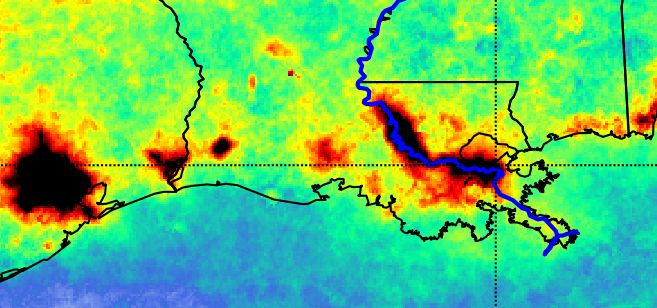
Mean tropospheric NO2 distribution along the Mississippi River averaged between December 2017 and October 2018.
Together, NO and NO2 are referred to as NOx, which is emitted from many human activities involving combustion, for example power plants, industrial processes, or car engines. Natural processes like lightning, biomass burning, or soil emissions also produce NOx. However, in over-densely populated regions, anthropogenic sources usually strongly dominate the observed levels. NO2 affects human health and is involved in many atmospheric chemical reactions like, for example, the formation of ozone smog.
One important advantage of satellite observations is that they reveal spatial patterns of trace-gas distributions. Since the atmospheric lifetime of NOx is rather short (usually a few hours), high atmospheric NOx levels are often found close to strong emission sources like power plants or cities. Thus, from trace-gas maps derived from S-5P/TROPOMI observations, many of these emission sources can be identified and quantified.
The NO2 map of the Mississippi region shows many such NOx hot spots. This is to be expected, because rivers usually attract humans and lead to the foundation of settlements, harbors, and marketplaces. Most of these places have high traffic density, which then causes high NOx pollution levels—especially in city centers. Power plants are also often located near rivers for cooling purposes, and industrial activities benefit from being located next to rivers because of the cheap transport of goods.
All of these sources are responsible for the high NO2 concentrations along the Mississippi River, as seen in the map from S-5P/TROPOMI. Here, it is also interesting to note that—especially in the southern part of the Mississippi—large areas to the west and east of the river show much smaller NO2 levels, indicating regions with less human activity.
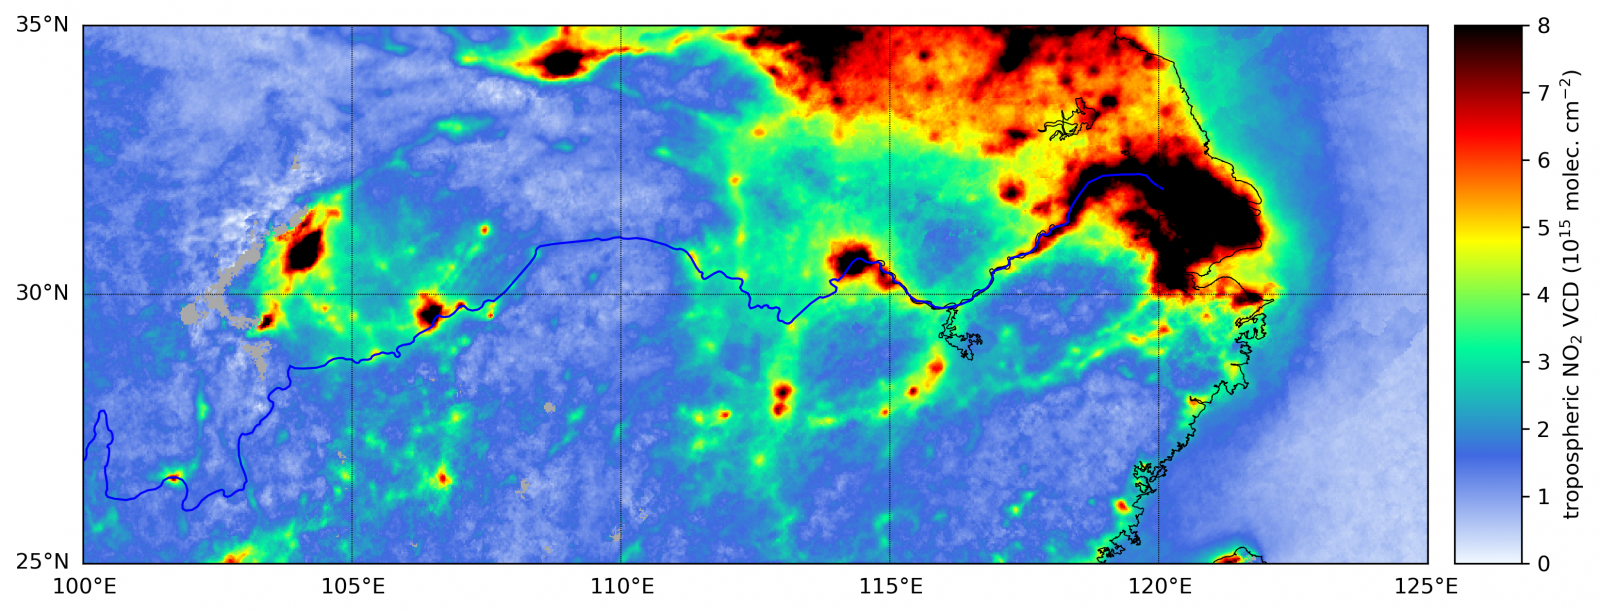
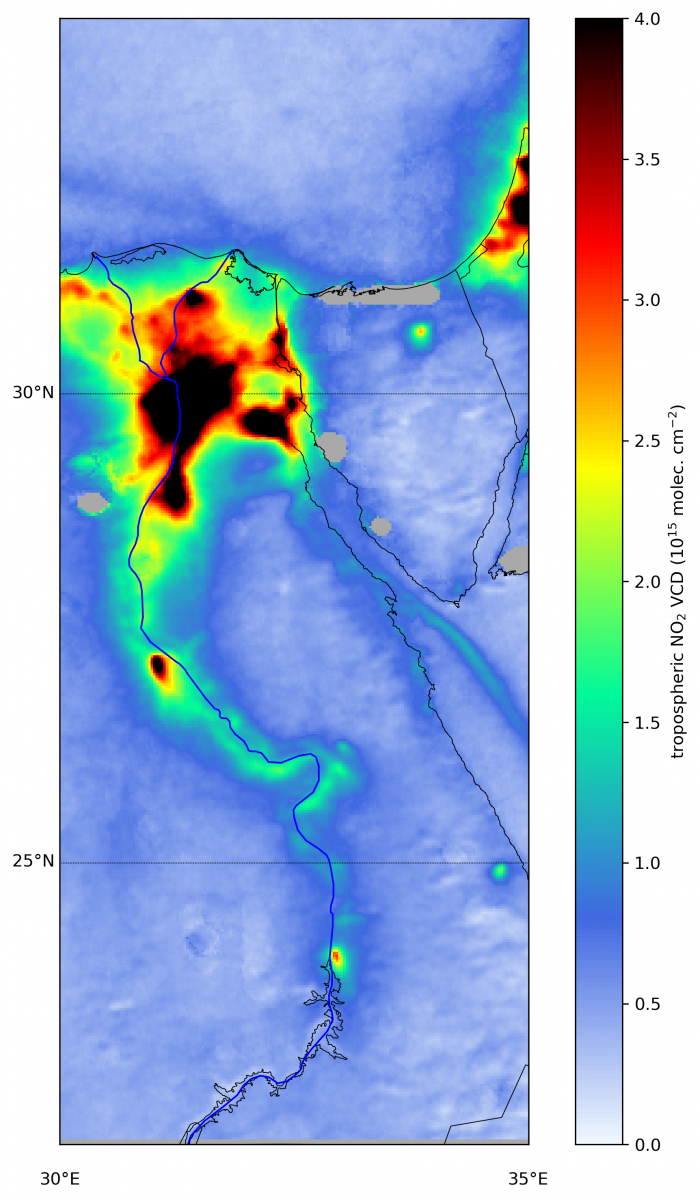
For comparison with other regions on Earth, maps of the average distribution of NO2 along the River Nile and Yangtze River are shown (please note the different color scales). Many pollution sources are identifiable along these rivers too, but, compared to the Mississippi region, the pollution levels are much higher. For the River Nile, the high NO2 values are located in the delta and in a narrow section along the river.
Mean tropospheric NO2 distribution along the Yangtze. Mean tropospheric NO2 distribution along the Nile.


